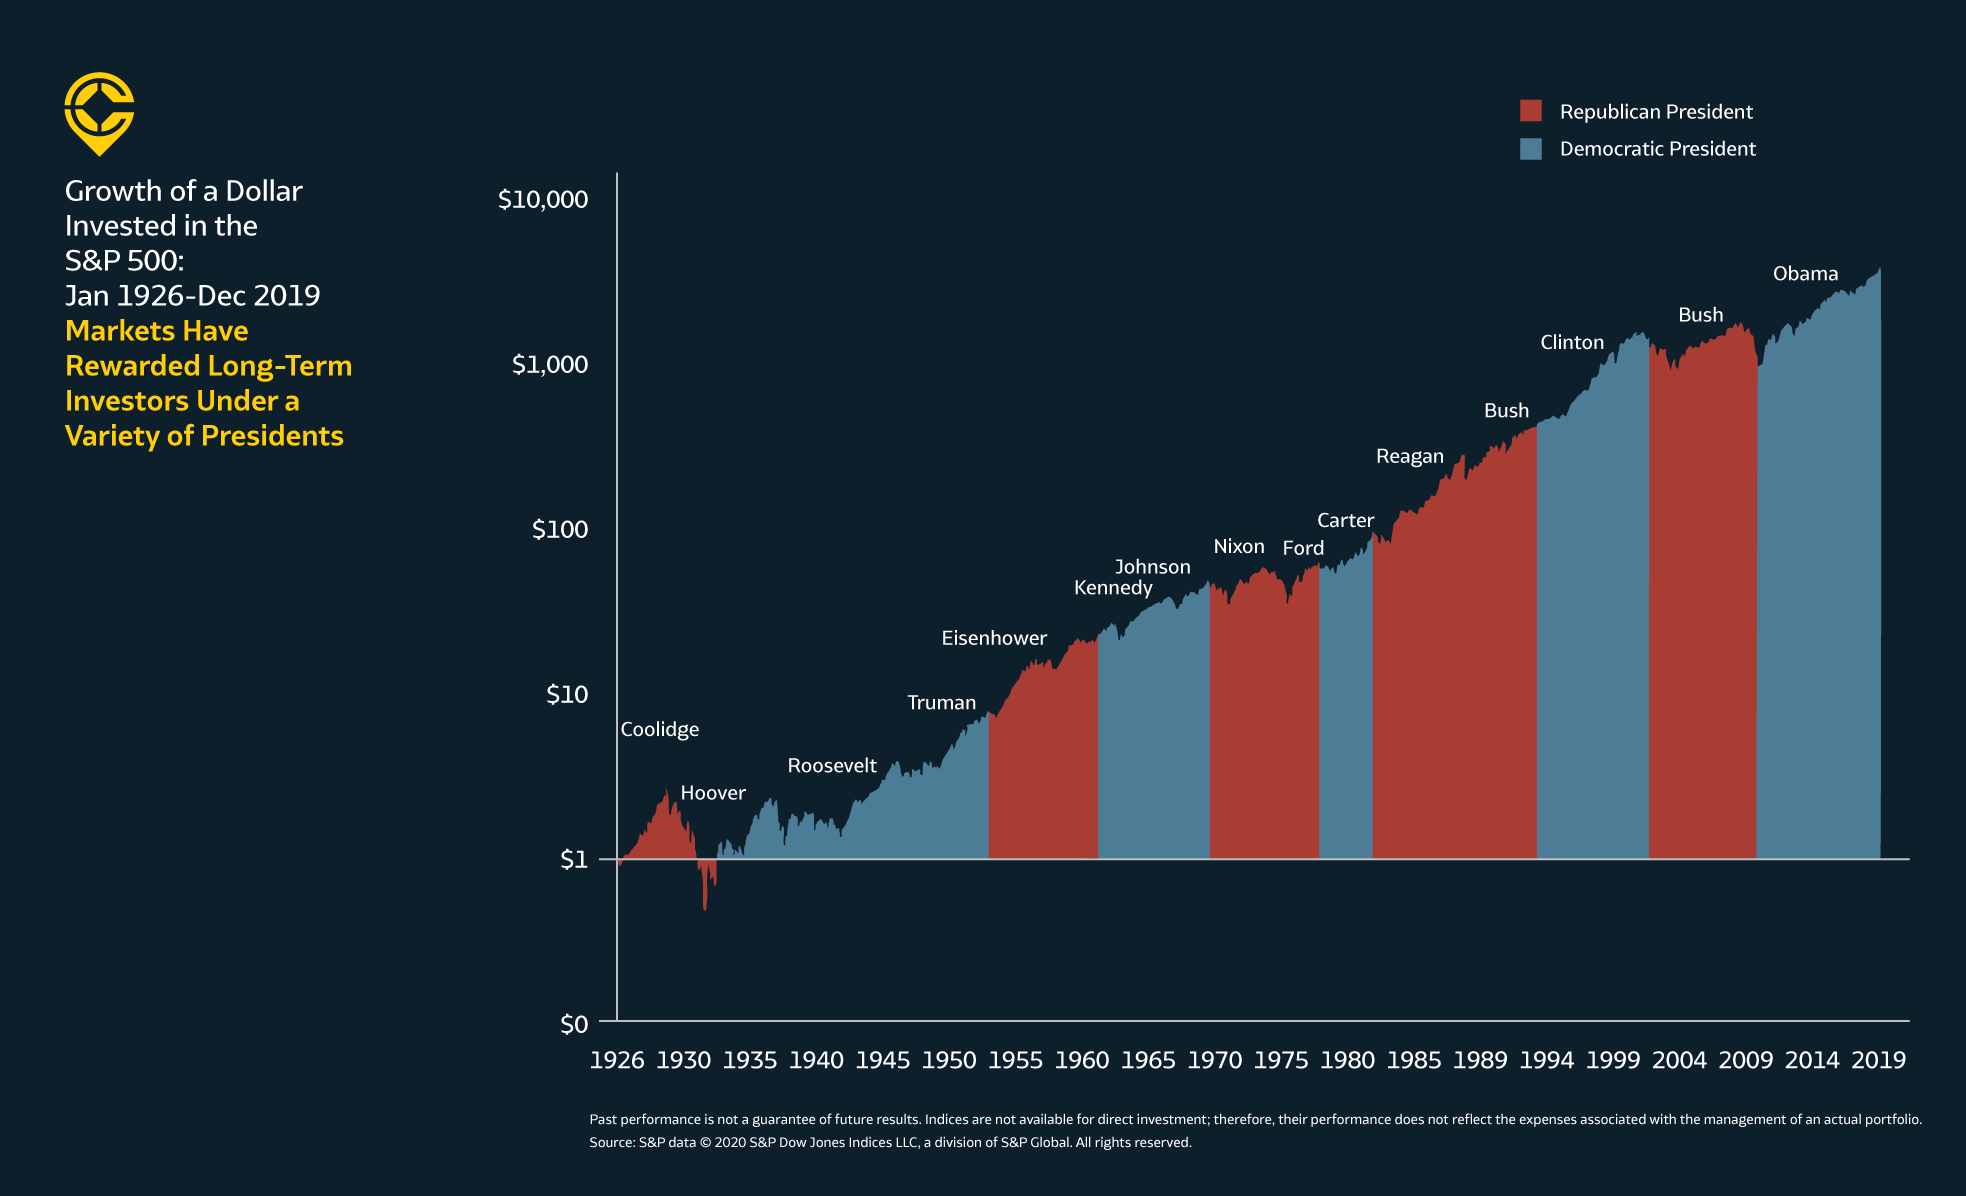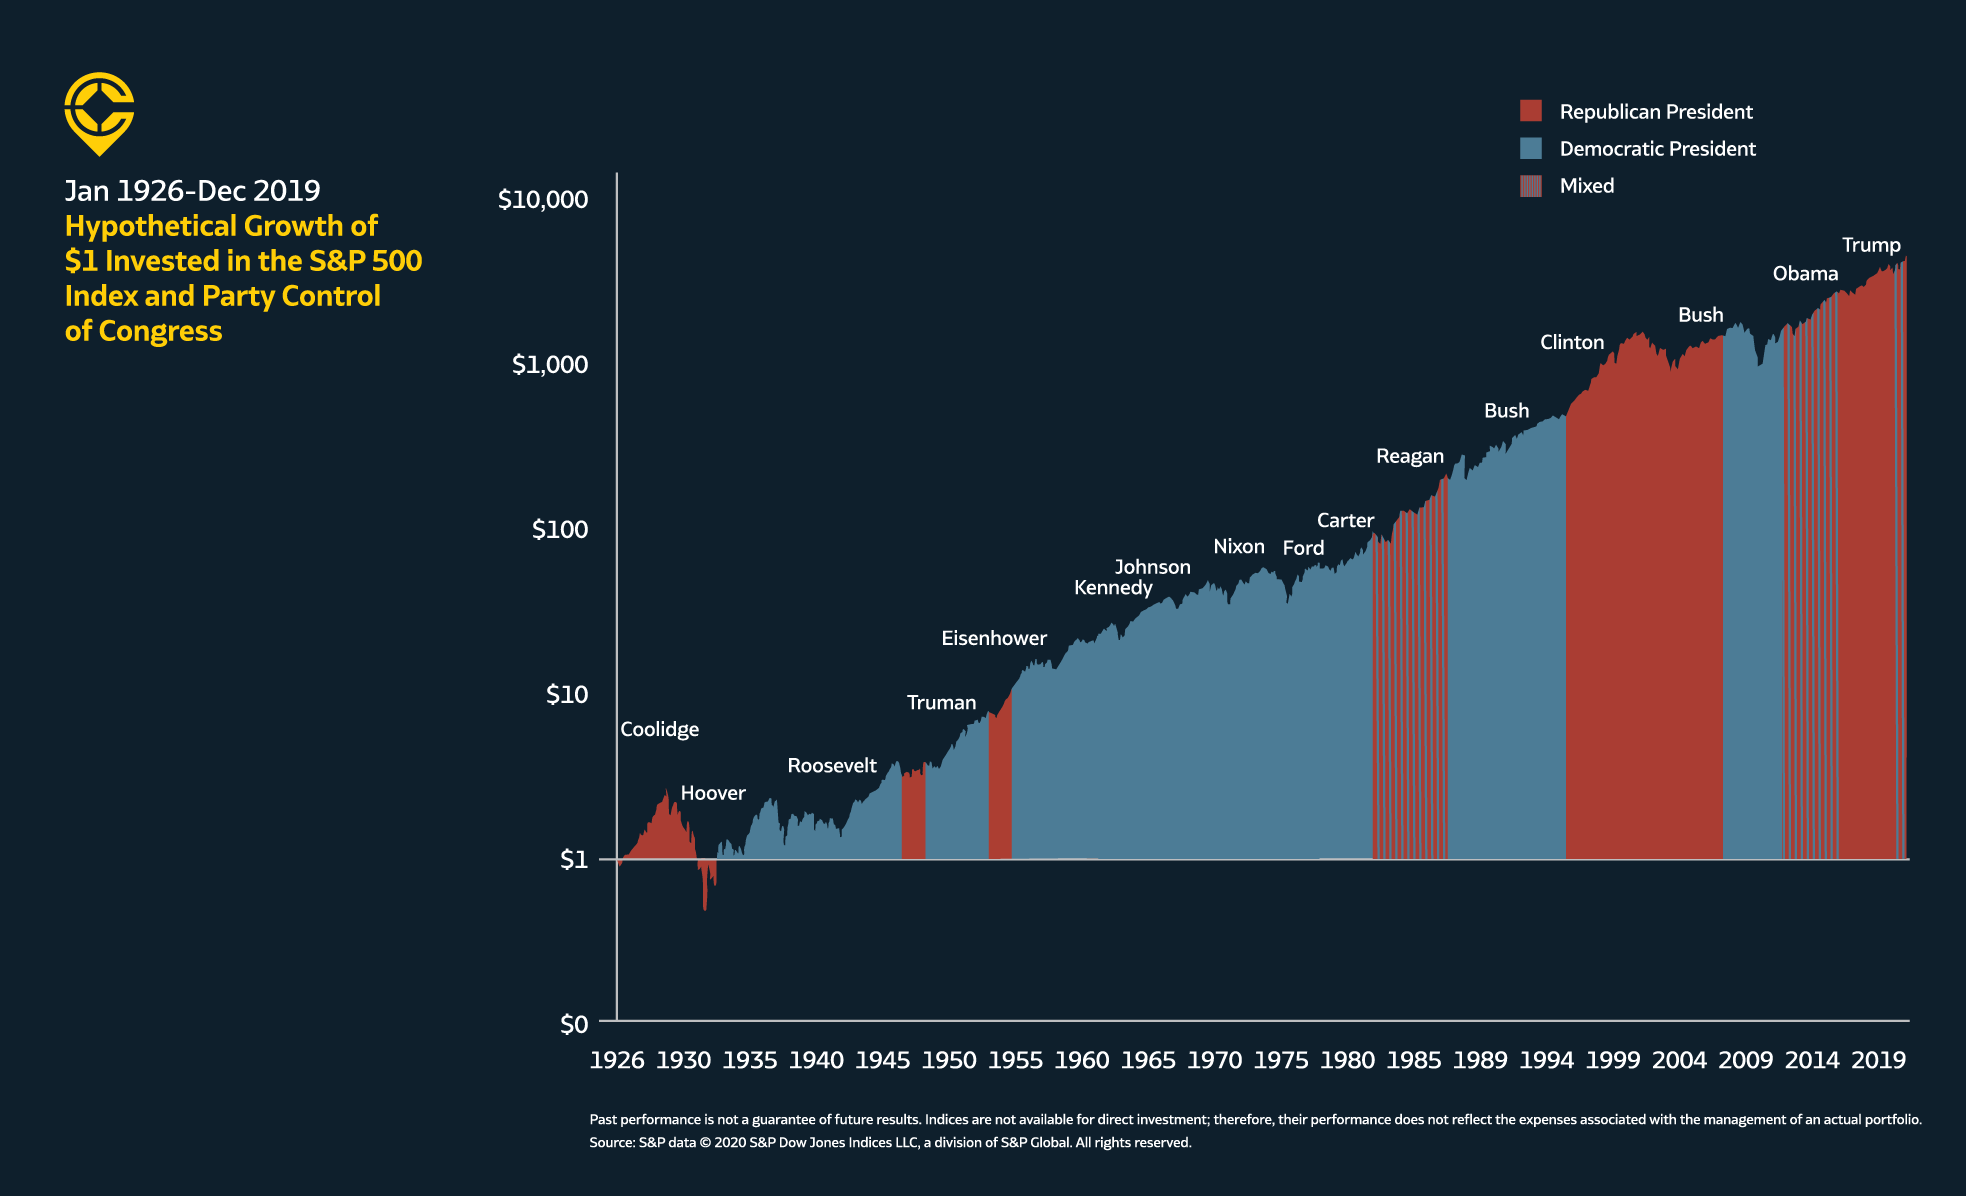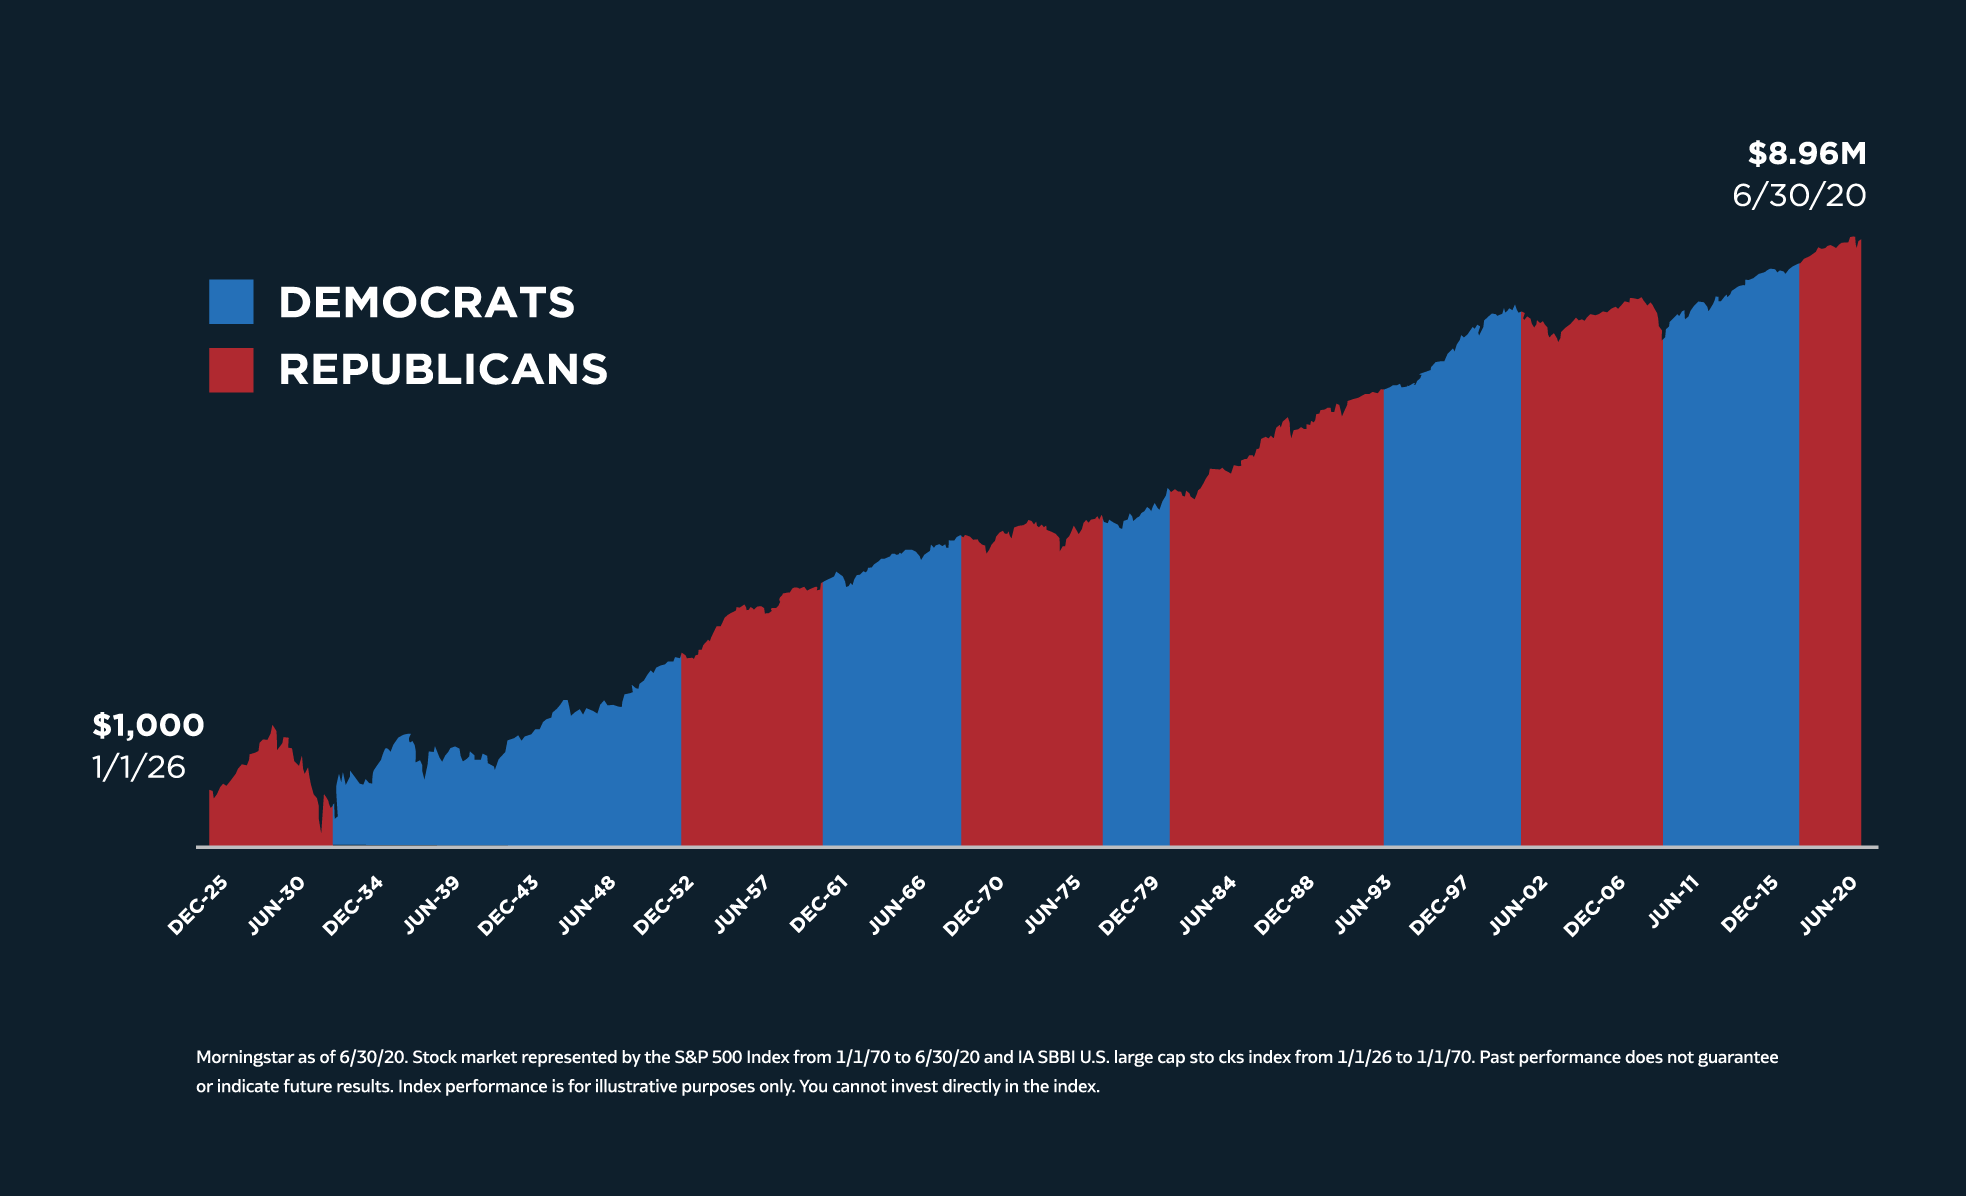
1. Stocks have continued higher regardless of presidential party:
As elections come up, we tend to get concerned about which party might be better for the market. Historically, the market has continued to rise, regardless of which party is in the White House. Since 1926, $1,000 invested in the S&P 500 would have grown to $8.96m as of 6/30/20, with a number of regime changes along the way.
2. U.S. Stocks across the election cycle: Stocks have historically performed above average in presidential election years. However, they’ve also tended to post their strongest performance in years where there is no presidential or midterm election.

3. Investors build cash in election years (especially this year) During presidential election years, there are usually greater inflows into money market funds than in years with no presidential election. This election year has seen historically large flows, due to the combined effect of the election and coronavirus pandemic.

4. Divided governments and the U.S. stock market: Stock markets tend to post stronger performance when the White House and Congress are controlled by the same party, on average. We have seen this happen roughly half of all presidential terms throughout history.
5. Stocks across a presidential term: Over a president’s term, the third year is often the highest performing year for the stock market. If a president is lucky enough to be elected to a second term, stock returns tend to reflect those of the first term (roughly 12% on average for each term).
6. New vs. incumbent presidents: On average, stocks have historically performed better in election years where an incumbent president wins reelection (13.4%) than when a new president is elected (9.3%).
7. Asset class performance in presidential election years: This year, we’re seeing asset classes performing much differently than their historical average in election years.
8. Market seasonality in election years: On average, the period known as “Mommies to Mummies” (May 1 to October 31) have historically performed worse than the period known as “Turkey to Tax” (November 1 to April 30). In election years, however, “Mommies to Mummies” tends to perform better than average, and “Turkey to Tax” tends to perform worse.

Read the next post in our Special Election Edition series:
Elections Matter But Not So Much to Your Investments
Source: Morningstar as of 6/30/20. Past performance is no guarantee of future results.
Index performance is shown for illustrative purposes only. You cannot invest directly in an index.
Important Disclosure: All Content is information of a general nature and does not address the circumstances of any particular individual or entity. This Content is for informational purposes only; you should not construe any such information or other material as legal, tax, investment, financial, or other advice as a specific recommendation or specific endorsement by Columbus Street. The information in this document is provided in good faith without any warranty and is intended for the recipient’s background information only. Columbus Street accepts no responsibility for loss arising from the use of the information contained herein. In exchange for using this Content, you agree not to hold Columbus Street liable for any possible claim for damages arising from any decision you make based on information or other Content made available to you. You alone assume the sole responsibility of evaluating the merits and risks associated with using any information or other Content provided by Columbus Street before making any decisions based on such information or other Content. You should consult with your tax advisor and financial professional before making any determination as to the appropriateness of any planning strategy indicated herein.

