
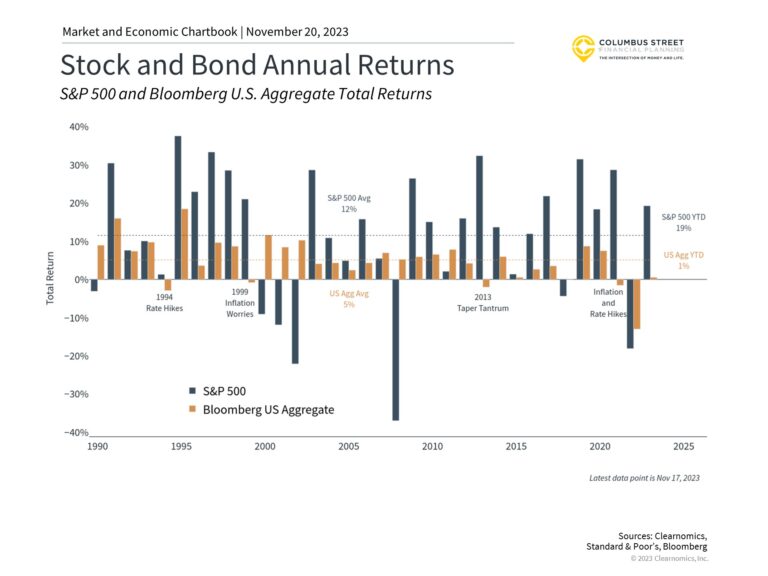
- Stocks and bonds have both struggled recently due to rising inflation and interest rates.
- This breaks the historical pattern driven by falling bond yields which supported bond prices.
- Despite this challenging period, investors should continue to focus on diversification as interest rates stabilize.
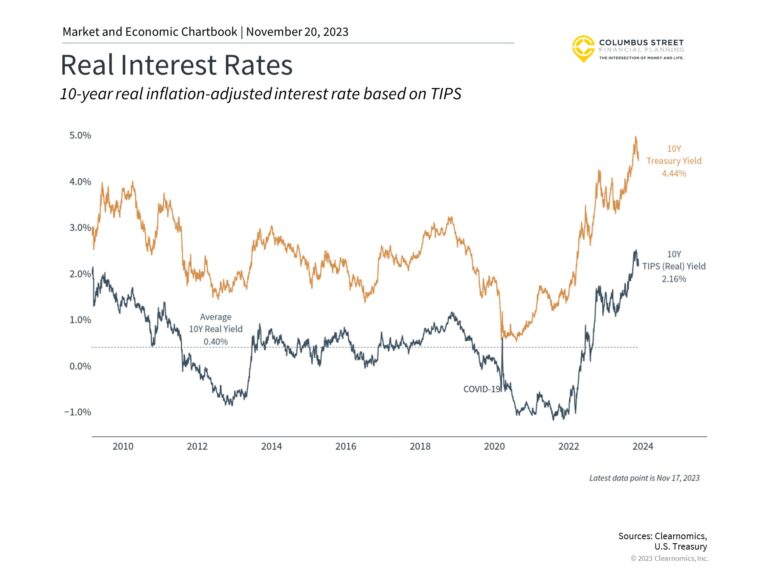
- Yields, after being adjusted for expected inflation, have increased over the past year as nominal interest rates have risen and expected inflation has fallen.
- Real yields have reached their highest levels since the 2008 financial crisis.
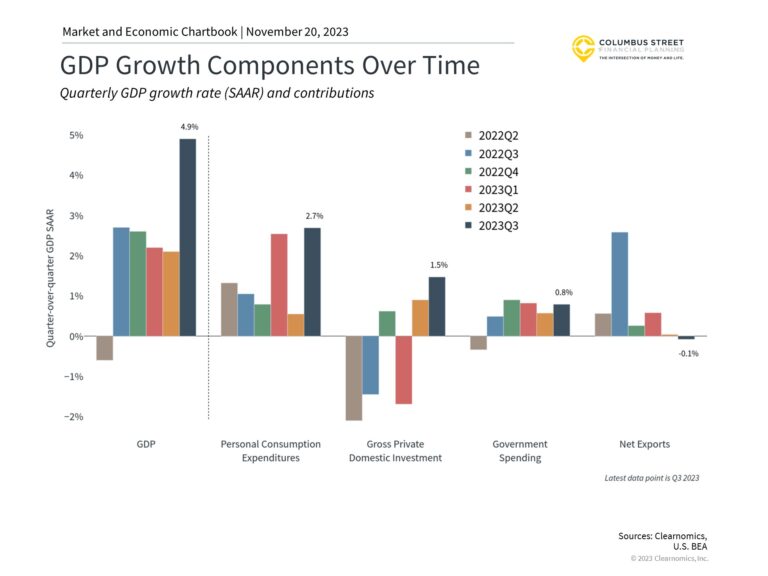
- Personal consumption expenditures have remained positive over the last few quarters, even as the economy slows.
- Investment and net exports have occasionally weighed down the headline GDP number, detracting from overall growth
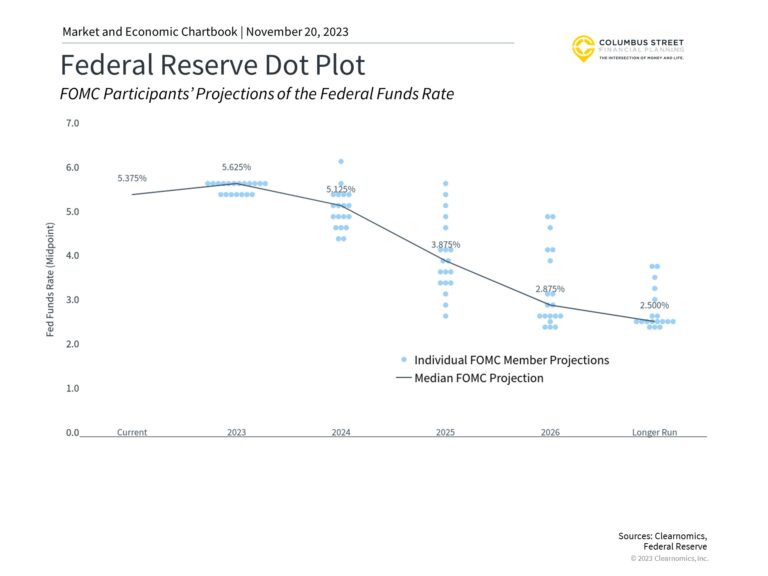
- Each quarter, the Federal Open Markets Committee updates their economic projections, including expectations for the federal funds rate.
- Their forecasts show that rates could remain high through 2023 and into 2024.
- The goal of the Fed is to achieve a strong unemployment rate and stable inflation.
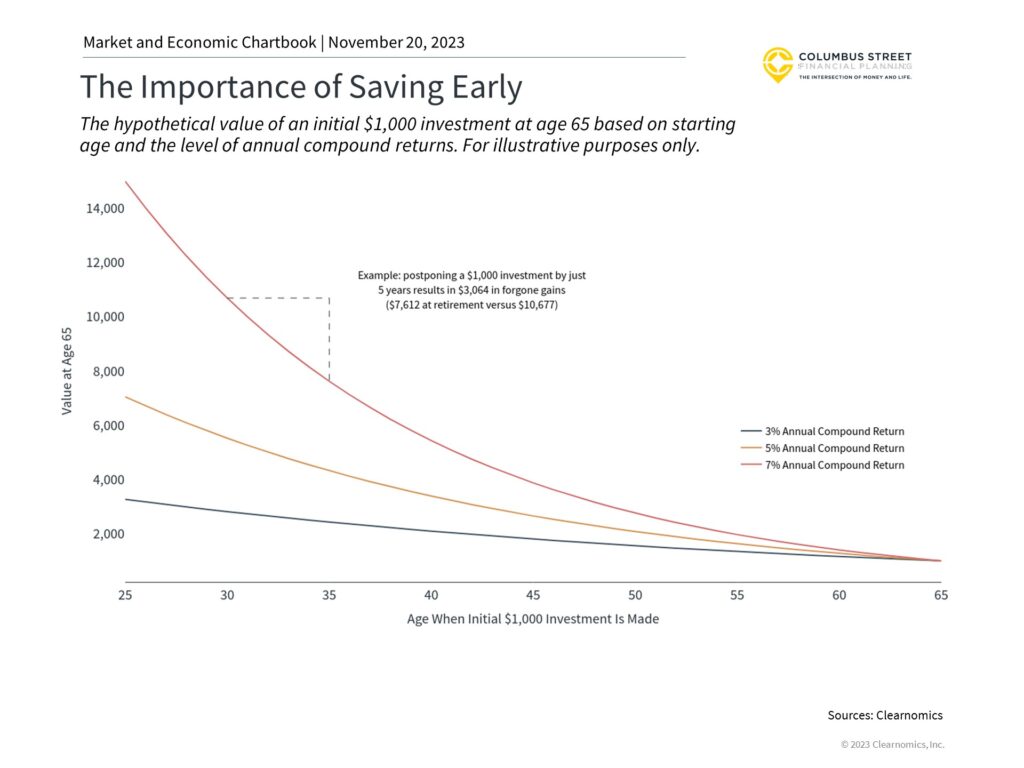
- A hypothetical investment at age 30 in an asset that compounds at 7% per year would be worth more than $10,000 at age 65.
- Long-term investors should focus on what they can control such as how much and when they invest.
- Investing at age 30, instead of age 40, makes as big a difference as experiencing a 5% or 7% annual return over the course of one’s life.
Definitions and Methodology
The S&P 500 is a market capitalization-weighted index of large cap U.S. stocks. U.S. mid cap and small cap are the S&P 400 and S&P 600, respectively. Value and growth are the corresponding Standard & Poor’s value and growth indices.
MSCI EM is an index of emerging market stocks. MSCI EAFE is an index of developed market stocks. MSCI ACWI is an index of global stocks. The forward P/E is a ratio of the current market price of an index divided by an estimate of earnings over the next twelve months. The Shiller P/E is based on Robert Shiller’s cyclically adjusted price-toearnings ratio.
The AAII Investor Sentiment index is based on a weekly survey conducted by AAII.
Unless stated otherwise, earnings and valuations data are from Refinitiv indices.
The LEI, or Leading Economic Index, is produced monthly by the Conference Board.
Consumer sentiment indices are based on surveys conducted by the University of Michigan Surveys of Consumers.
Asset Class Performance and Asset Classes Relative to U.S. Stocks charts: The EM, EAFE, Small Cap, Fixed Income and Commodities are these indices, respectively: MSCI EM, MSCI EAFE, Russell 2000, iShares Core U.S. Bond Aggregate, Bloomberg Commodity Index.
Fixed Income Performance: All sectors are represented by the Bloomberg Barclays bond indices except for EM D USD and Local which are the JPMorgan EMBIG Diversified Index and JPMorgan GBIEM Core Index, respectively.
The Balanced Portfolio is a hypothetical 60/40 portfolio consisting of 40% U.S. Large Cap, 5% Small Cap, 10% International Developed Equities, 5% Emerging Market Equities, 35% U.S. Bonds, and 5% Commodities.
The Bloomberg Commodity Index is a broadly diversified basket of physical commodities futures contracts.
The DXV is a U.S. dollar index based on a basket of currencies, including the Euro, Yen, Pound, Canadian Dollar, Swedish Krona and Swiss Franc.
Portfolio Risk/Reward and Portfolio Drift Since 2009 charts: stocks and bonds are the S&P 500 and iShares Core U.S. Bond Aggregate, respectively. Each portfolio represents a hypothetical stock/bond asset allocation.
The MSCI Factor indices are created and maintained by MSCI to capture factor returns. They cover various factors including Quality, Size, Momentum, Volatility, Value and Yield. The Multi-Factor index tracks the performance of Value, Momentum, Quality and Size.
The MSCI USA index tracks large and mid cap U.S. stocks.
Important Disclosure: All Content is information of a general nature and does not address the circumstances of any particular individual or entity. This Content is for informational purposes only; you should not construe any such information or other material as legal, tax, investment, financial, or other advice as a specific recommendation or specific endorsement by Columbus Street. The information in this document is provided in good faith without any warranty and is intended for the recipient’s background information only. Columbus Street accepts no responsibility for loss arising from the use of the information contained herein. In exchange for using this Content, you agree not to hold Columbus Street liable for any possible claim for damages arising from any decision you make based on information or other Content made available to you. You alone assume the sole responsibility of evaluating the merits and risks associated with using any information or other Content provided by Columbus Street before making any decisions based on such information or other Content. You should consult with your tax advisor and financial professional before making any determination as to the appropriateness of any planning strategy indicated herein.

