Equities have long served as a cornerstone of investment portfolios designed for long-term growth. When integrated into a well-rounded financial strategy, stocks have demonstrated the ability to build wealth and help individuals reach their financial objectives over time. An important consideration, however, is determining which types of equities to hold. While market participants and financial media often concentrate on the largest corporations, numerous other categories exist that can serve valuable functions within diversified investment portfolios.
Many people equate the broader equity market with indices like the S&P 500 or the Dow Jones Industrial Average. The S&P 500 represents an index comprising the 500 largest publicly traded corporations, with each weighted according to its market capitalization—a metric reflecting company size. Meanwhile, the Dow consists of just 30 large, established corporations. Both indices predominantly feature companies that are incorporated and have their headquarters in the United States.
Given their construction methodology, these benchmarks concentrate exclusively on America’s largest corporations. This focus proves useful for gauging overall market trends and economic conditions, as the biggest companies tend to drive these broader patterns. Nevertheless, when constructing investment portfolios, relying solely on these indices may cause investors to miss other promising areas. This consideration becomes particularly important when a small number of “mega cap” companies, including members of the Magnificent 7, have been the predominant contributors to both gains and losses in recent periods.
Given this market landscape, what strategies can investors employ to expand their investment perspective? Small-cap equities and international markets represent two areas that can deliver both opportunities and diversification benefits. Each possesses unique characteristics and potential advantages that can strengthen portfolio diversification, particularly during periods of market turbulence and economic uncertainty.
Small-cap equities have underperformed but provide diversification advantages

Small-cap equities represent corporations with market capitalizations generally between a few hundred million and approximately two billion dollars. This stands in contrast to mid and large-cap corporations that range from tens to hundreds of billions, while mega caps have reached valuations in the trillions.
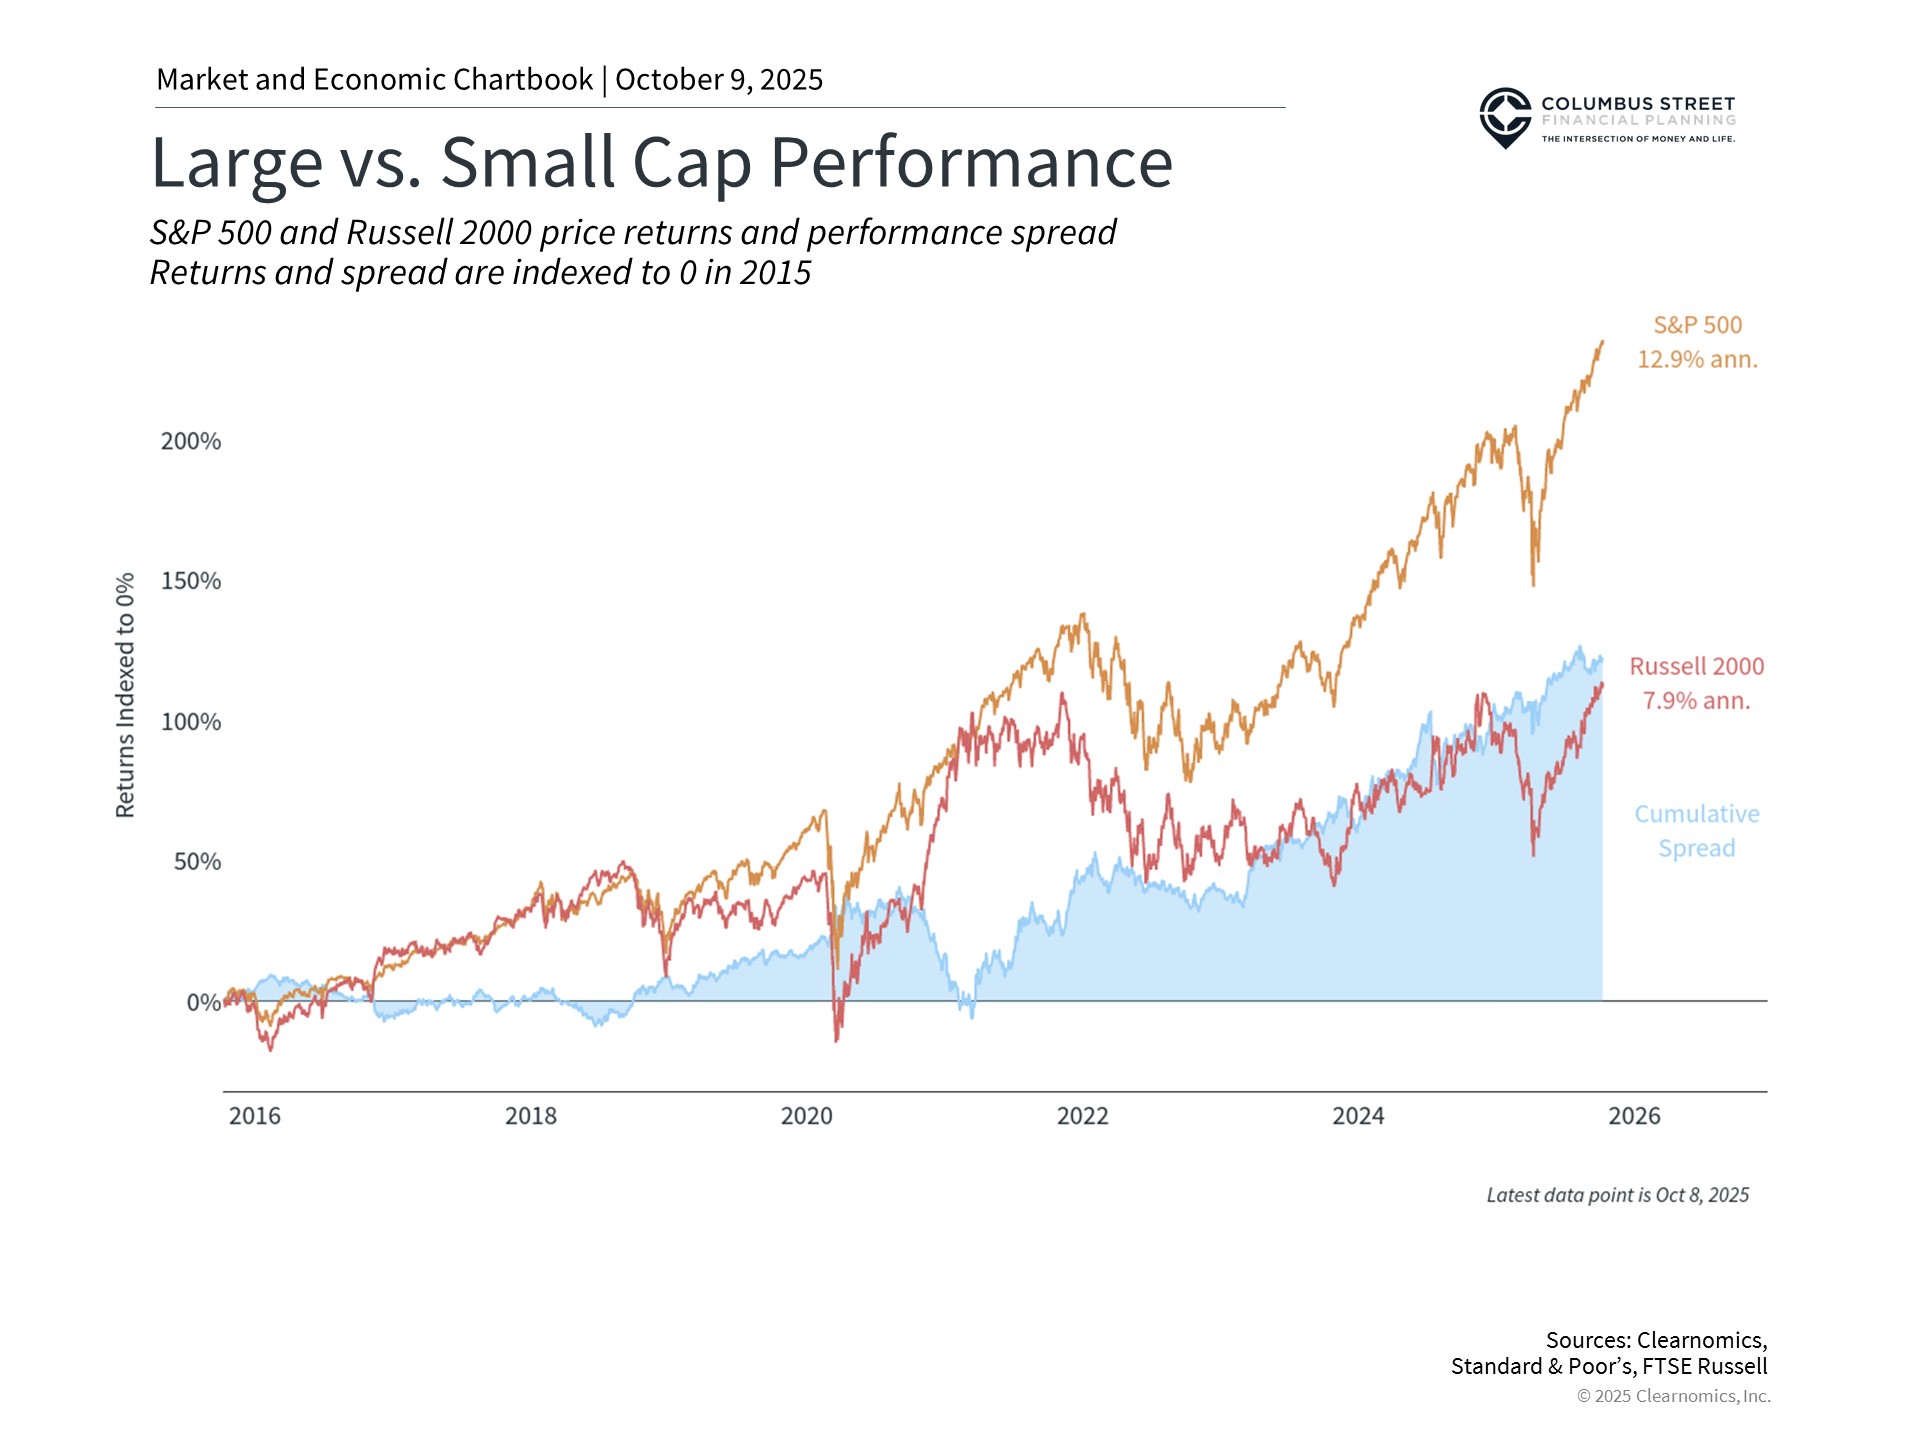
The Russell 2000 index, a benchmark for small-cap performance, has delivered 5.0% in annualized returns over the trailing decade versus 10.5% for the S&P 500, according to the data shown in the accompanying chart.1
This performance differential has become especially notable in recent years as market concentration among large and mega cap corporations has intensified, particularly within technology and artificial intelligence-related industries. Small-cap corporations generally have reduced exposure to the technology sector and generate a larger portion of their revenues from domestic operations, which makes them more responsive to shifts in U.S. economic policy and trade dynamics.
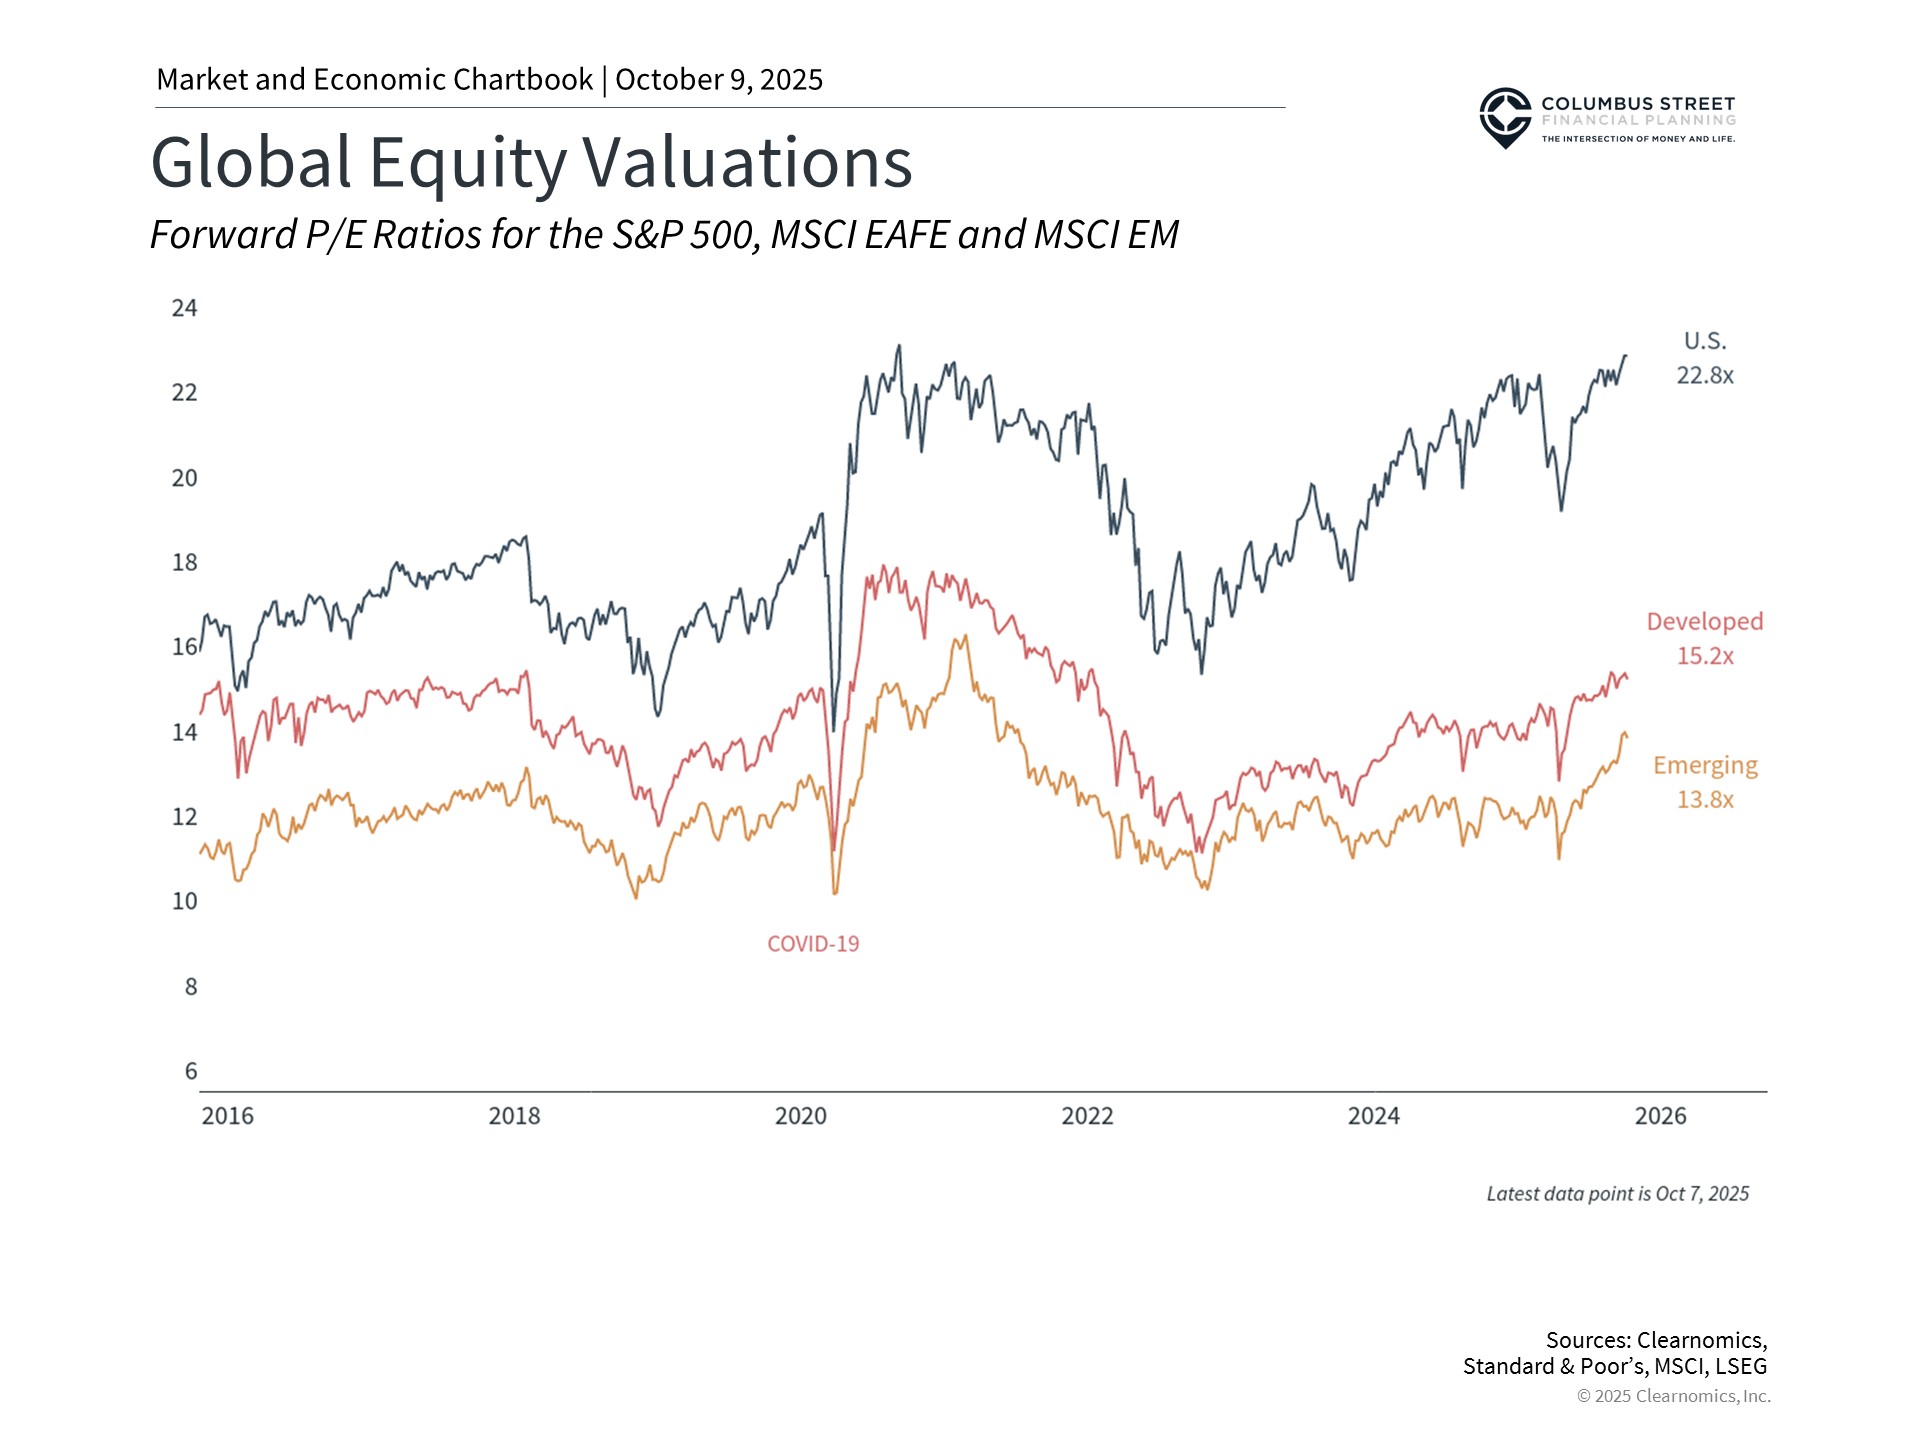
Of particular note, small caps have faced headwinds year-to-date amid continued uncertainty regarding tariffs and economic expansion. Nevertheless, this situation has resulted in potentially appealing valuations. Small-cap equities currently trade at more modest price-to-earnings ratios when compared to large-cap equities. The Russell 2000 presently carries a price-to-earnings ratio significantly below its 10-year average. Even more noteworthy is the price-to-book value of roughly 0.8x, substantially lower than the historical average of 1.2x. By comparison, numerous valuation metrics for the S&P 500 stand well above average, with some approaching record highs.
The interest rate landscape represents another significant distinction between large and small-cap corporations. Small caps typically depend more extensively on floating rate debt financing than their large-cap peers, which makes them more vulnerable to interest rate movements. Although this created obstacles when interest rates increased sharply starting in 2022, the more stable conditions since that time could prove beneficial. This holds especially true if the Fed proceeds with additional rate cuts later this year.
These various metrics suggest that small-cap equities currently offer more attractive valuations than numerous other market segments. While large caps will remain an essential component of many portfolios, this observation underscores the fact that investment opportunities exist throughout many different areas of the market.
International markets maintain attractive valuations

International equities represent another area featuring attractive valuations. These investments are generally divided into two primary categories: developed markets (encompassing regions such as Europe, Japan, and Australia) and emerging markets (incorporating countries like China, India, and Brazil). These designations reflect variations in economic development, market infrastructure, regulatory environments, and additional factors.
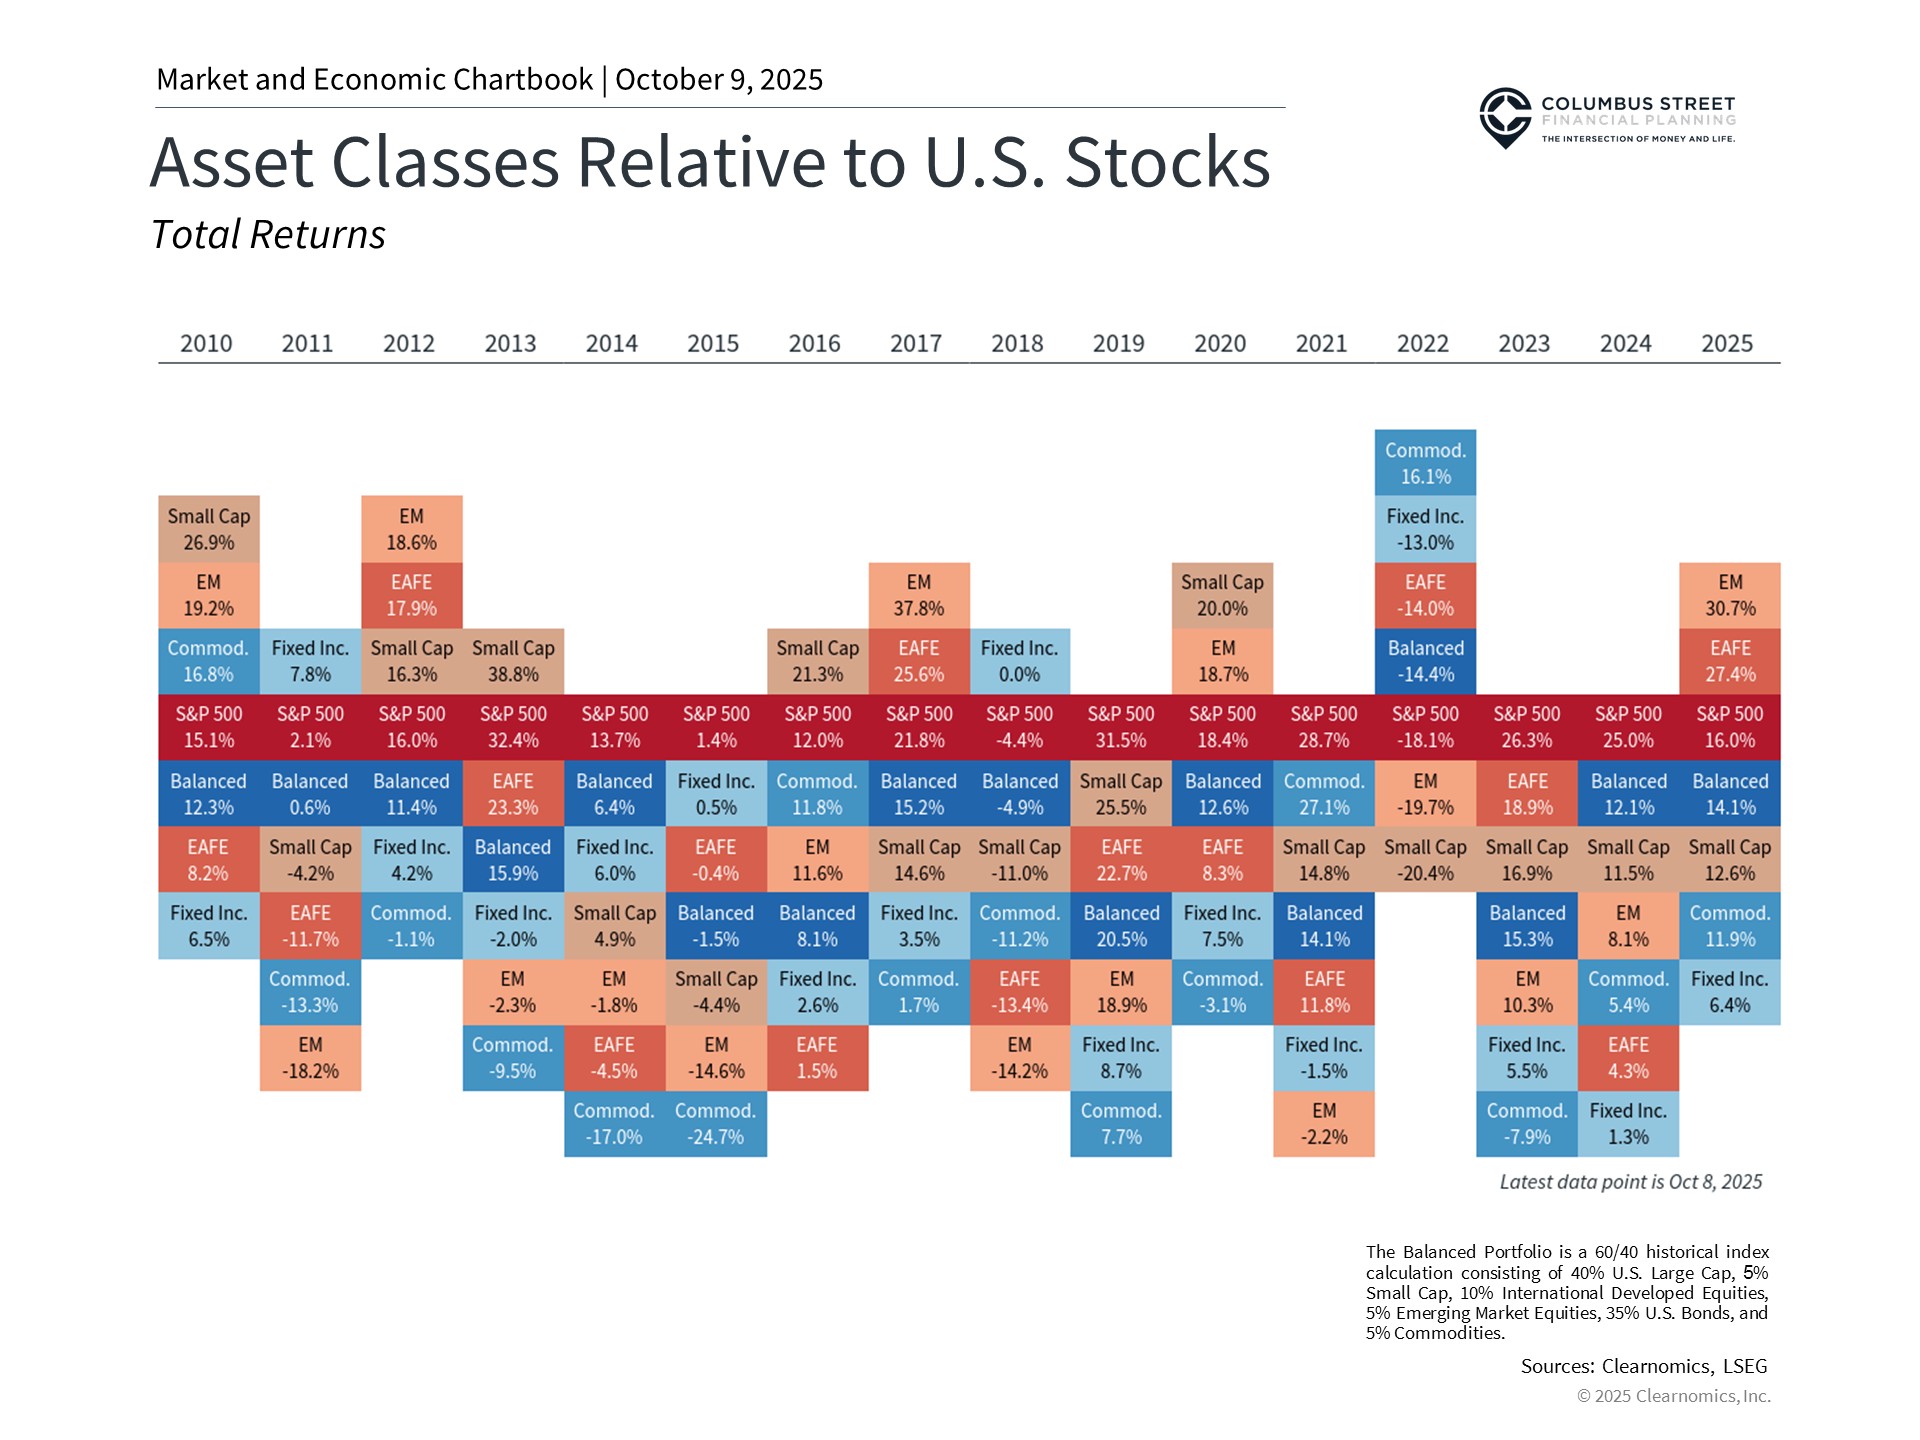
While U.S. equities have led global markets throughout much of the previous decade, international equities have demonstrated superior performance this year. More specifically, the MSCI EAFE index, which monitors 21 major developed market countries, has advanced approximately 17.5% year-to-date when measured in U.S. dollar terms. The MSCI EM index, tracking emerging markets, has increased 10%.2
This outperformance has materialized despite global uncertainty stemming from trade considerations.
Beyond their superior performance this year, valuation disparities remain considerable. Whereas the S&P 500 trades at elevated price-to-earnings ratios, international markets present more attractive valuations, as illustrated in the chart above. This valuation gap stems partly from political and economic headwinds in many of these regions throughout the past decade, some of which have started to improve.
A significant distinction between domestic and international investing involves currency fluctuations, which can influence returns. Notably, the weaker dollar has generated favorable conditions for U.S.-based investors. When foreign currencies strengthen, the assets denominated in those currencies gain value, enabling conversion back into more dollars. This currency benefit has meaningfully contributed to the robust performance of international equities this year, delivering an extra boost beyond the fundamental performance of foreign corporations.
Diversifying across regions and market capitalizations remains important

For investors with long-term horizons, preserving exposure to areas like small-cap and international equities can contribute to more balanced portfolios. This approach becomes particularly relevant following the significant outperformance of large-cap equities, which has been concentrated among just a small number of the largest companies.
This perspective does not suggest that U.S. large caps will diminish in importance. Nor does it advocate for dramatic adjustments to well-designed portfolios. Rather, successful long-term portfolio management involves maintaining appropriate asset allocation across all these investment categories. By incorporating more attractively valued market segments, investors can potentially enhance long-term risk-adjusted outcomes and capitalize on market opportunities. Although any individual asset class may lag during certain timeframes, their varying characteristics and return patterns can deliver valuable diversification advantages over extended periods.
The bottom line? Although the S&P 500 and Dow serve as important benchmarks, investors should evaluate the advantages of diversifying across numerous other market segments, including smaller corporations and international equities. Maintaining properly allocated portfolios for the long term continues to represent the most effective approach to achieving financial success.
1. Russell 2000 and S&P 500, price returns, from January 2, 2015 to May 23, 2025
2. MSCI EAFE and MSCI EM, total returns, January 1, 2025 to May 23, 2025
Important Disclosure: All Content is information of a general nature and does not address the circumstances of any particular individual or entity. This Content is for informational purposes only; you should not construe any such information or other material as legal, tax, investment, financial, or other advice as a specific recommendation or specific endorsement by Columbus Street. The information in this document is provided in good faith without any warranty and is intended for the recipient’s background information only. Columbus Street accepts no responsibility for loss arising from the use of the information contained herein. In exchange for using this Content, you agree not to hold Columbus Street liable for any possible claim for damages arising from any decision you make based on information or other Content made available to you. You alone assume the sole responsibility of evaluating the merits and risks associated with using any information or other Content provided by Columbus Street before making any decisions based on such information or other Content. You should consult with your tax advisor and financial professional before making any determination as to the appropriateness of any planning strategy indicated herein. Clearnomics, “Exploring Investment Opportunities Beyond Large-Cap U.S. Stocks,” September 2025, www.clearnomics.com


